What is a Key Performance Indicator (KPI)?
What Is a Key Performance Indicator (KPI)?
Key Performance Indicators (KPIs) are the critical, quantifiable measures of progress toward a desired result. They help organizations determine if their efforts are making an impact, allocate resources effectively, and focus improvements where they matter most. KPIs provide a solid foundation for strategic and operational decision-making. Typically, they balance leading indicators (which forecast future performance) with lagging indicators (which reflect outcomes achieved) to guide both planning and review.
Why KPIs Matter
- Drive Performance Improvement: KPIs spotlight the metrics that truly move the needle, directing attention toward impactful initiatives.
- Enable Data Driven Decisions: Rather than relying on gut feeling, leaders can make smart calls based on clear, relevant metrics.
- Ensure Strategic Alignment: Using the right KPIs ensures that daily tasks connect meaningfully to broader organizational goals.
Keys to Developing Effective KPIs
Creating KPIs that work takes both art and science:
- Understand your goals: good KPIs truly reflect and measure strategic priorities.
- Follow a disciplined framework, such as the MPRA (Measure–Perform–Review–Adapt), to guide development and sustain improvement over time.
- Embed accountability and ownership through governance practices—assign clarity on who tracks, updates, and reports each KPI.
- Visualize performance smartly with dashboards, scorecards, and trend analyses that help move from data to insight.
Good KPIs:
- Provide clear, objective evidence of progress toward a specific goal
- Measure exactly what they are intended to, enabling better decision-making
- Allow performance comparisons over time to identify trends and improvements
- Can assess various dimensions such as efficiency, effectiveness, quality, timeliness, compliance, behavior, cost, project success, staff performance, or resource use
- Maintain a healthy balance between leading (predictive) and lagging (outcome) indicators
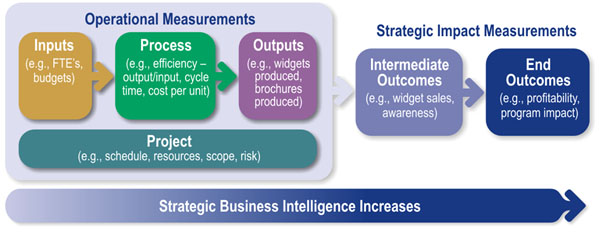
Terminology Examples

Input Measures:
- Definition: Track the resources used to produce a product or service.
- Example: Quality of coffee beans, supplier reliability, water purity, employee time or labor costs, and storage conditions.
Process Measures:
- Definition: Monitor how efficiently and effectively work is performed.
- Example: Coffee-making procedures, equipment efficiency, brew consistency, and adherence to preparation standards.
Output Measures:
- Definition: Measure the immediate results of a process or activity.
- Example: Quantity of coffee produced, temperature, taste, strength, style, presentation, and availability of accessories (e.g., cream, sugar).
Outcome Measures:
- Definition: Reflect the impact or value delivered to the customer or end user.
- Example: Customer satisfaction ratings, repeat business, and overall event coffee sales.
Project Measures:
- Definition: Track progress and results of specific projects or improvement initiatives.
- Example: Deliverables and milestones from a new marketing campaign or service enhancement project.

Lagging Indicator:
- Definition: Measures the result of past actions or performance.
- Example: Current body weight (e.g. in lbs or kg) reflects past eating and exercise habits.
Leading Indicator:
- Definition: Predicts future performance and helps influence outcomes.
- Example: Daily calorie intake (e.g. calories/day) is a driver of future weight loss.
Baseline:
- Definition: The current or historical level of performance used as a starting point.
- Example: Starting weight (e.g. current weight, say, 250 lbs / 113 kg) is the baseline for tracking progress.
Benchmarking:
- Definition: Comparing performance to a standard or best practice.
- Example: I might pick someone to emulate that I can base my target weight on (e.g. say, 185 lbs / 84 kg).
Target:
- Definition: The desired future level of performance for a KPI.
- Example: 1,700 calories/day might be the target for the leading indicator (calorie intake) to help reach the lagging indicator target of 185 lbs / 84 kg within a year.
Examples of KPIs
While the examples below illustrate common KPIs used across industries, they are provided for demonstration purposes only. The Balanced Scorecard Institute does not recommend adopting these measures without careful consideration. Effective KPIs are not off-the-shelf—they must be thoughtfully developed to reflect your organization’s unique strategy, goals, and context. At the Balanced Scorecard Institute, we guide organizations through a structured, proven methodology (MPRA) to create meaningful KPIs that truly drive performance improvement and strategic alignment.
Financial Perspective (or Stewardship)
Strategic Focus: Example KPIs
- Revenue Growth: Revenue growth rate, % of revenue from new products/services
- Cost Management: Operating cost as % of revenue, Cost per unit of service/product
- Profitability: Net profit margin, Return on investment (ROI), Earnings before interest and taxes (EBIT)
- Asset Utilization: Return on assets (ROA), Working capital turnover
Customer / Stakeholder Perspective
- Customer Satisfaction: Customer satisfaction score (CSAT), Net Promoter Score (NPS)
- Customer Retention: Customer retention rate, Churn rate
- Market Share: Market share by segment or region
- Service Quality: % of on-time deliveries, First call resolution rate
Internal Process Perspective
- Process Efficiency: Cycle time per unit, % of processes automated
- Quality Control: Defect rate, Error rate
- Innovation & Improvement: Time to market for new products, R&D investment as % of revenue
- Compliance & Risk: % of audits passed, Incident resolution time
Organizational Capacity (Learning & Growth)
- Employee Development: % of employees trained, Average training hours per employee
- Knowledge Management: Knowledge sharing index, % of employees accessing knowledge systems
- Employee Engagement: Employee satisfaction score, Voluntary turnover rate
- Technology Capability: IT system uptime, User adoption rate of new tools